Key Takeaways
- Nifty 50 is teetering at a critical support level, with volatility driven by geopolitical risks and mixed corporate earnings.
- Technical indicators like RSI and MACD hint at potential breakout directions, while FII activity remains a wildcard.
- Experts emphasize disciplined risk management, including stop-loss orders and hedging with options.
- Historical data shows Nifty has rebounded 68% of the time after a 10% correction, but past performance isn’t a guarantee.
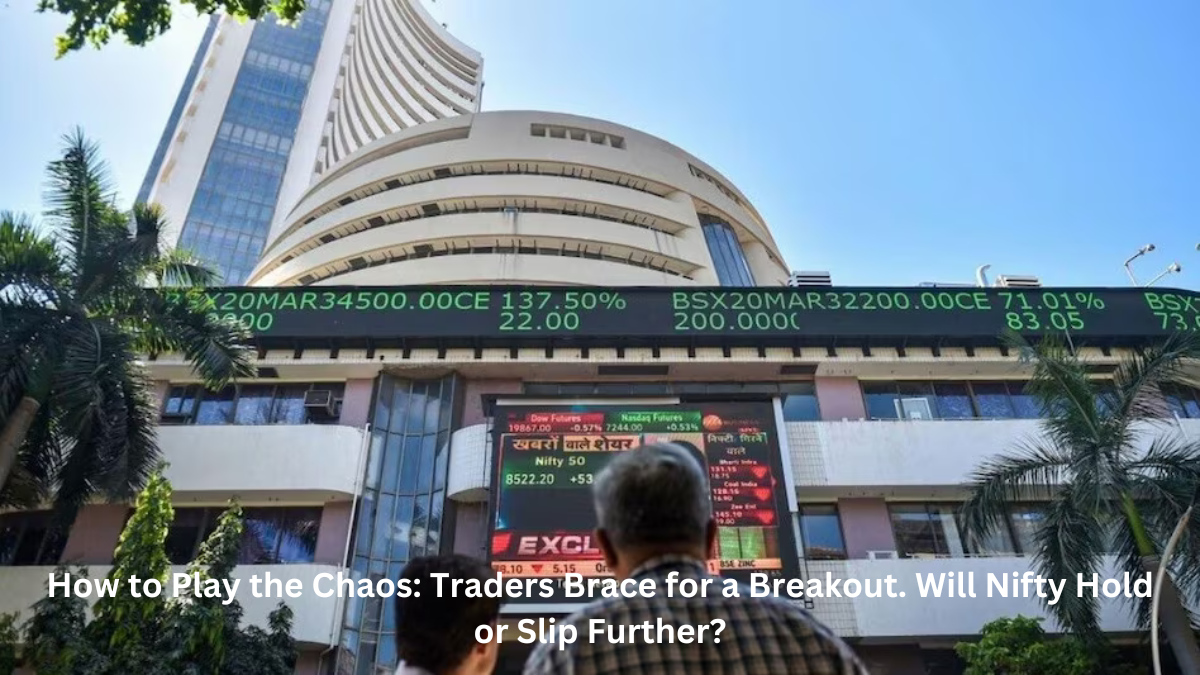
Introduction: The Market’s Tug-of-War
Picture this: Rahul, a seasoned trader in Mumbai, stares at his screen as the Nifty 50 swings wildly. One moment, it’s flirting with 22,500, a key resistance level; the next, it plunges to 21,800, testing critical support. The question on every trader’s mind: Is this the calm before a storm, or a storm before calm?
With India’s benchmark index caught in a tightening range, traders are bracing for a breakout. But which way will it go? Let’s decode the chaos.
Understanding the Current Market Volatility
What’s Driving the Chaos?
The Nifty’s rollercoaster ride isn’t random. Three forces are at play:
- Geopolitical Tensions: Rising oil prices and Middle East conflicts are spooking foreign investors.
- Earnings Season Surprises: While IT giants like TCS beat estimates, banks like HDFC underperformed, creating sectoral imbalances.
- Federal Reserve Uncertainty: Will rate cuts happen in 2024? The dollar’s strength is rattling emerging markets.
Historical Context: Lessons from Past Breakouts
In April 2023, Nifty broke below 17,000 amid Adani Group turmoil but rebounded 15% in six weeks. Similarly, during the 2020 COVID crash, it dropped 40% before soaring to new highs. History favors the bold—if they time it right.
Technical Analysis: Decoding Nifty’s Next Move
Key Levels to Watch
- Support: 21,800 (200-day moving average) – A break below could trigger panic selling.
- Resistance: 22,500 (all-time high) – Sustained closes above this level may signal a bull run.
Indicators Signaling a Breakout
- RSI (Relative Strength Index): At 58, Nifty is neither overbought nor oversold, suggesting room for movement.
- MACD (Moving Average Convergence Divergence): A bearish crossover last week hints at short-term downside risk.
Example: In January 2024, a similar MACD crossover preceded a 5% dip. Traders who set stop-losses at 21,900 minimized losses.
Fundamental Factors at Play
Economic Indicators
- GDP Growth: India’s 7.8% Q3 growth supports long-term optimism.
- FII Activity: Foreign investors pulled ₹12,000 crore in April, the highest outflow since 2022.
The Geopolitical Wildcard
Iran-Israel tensions could spike oil to 100/barrel,hurtingIndia’simportbill.“Every100/barrel,hurtingIndia’simportbill.“Every10 rise in oil shaves 0.5% off India’s GDP,” warns economist Ajay Srivastava.
Expert Insights: What the Pros Are Saying
Bull vs. Bear Debate
- Bullish View (Sanjeev Prasad, Kotak Institutional Equities): “Nifty could hit 24,000 by December if monsoon normalizes and FIIs return.”
- Bearish Take (Shankar Sharma, First Global): “Valuations are stretched. A 10% correction is likely before earnings catch up.”
Risk Management Strategies
- Stop-Loss Discipline: “Always define your risk. If Nifty breaks 21,800, exit 50% of your position,” advises Zerodha’s Nithin Kamath.
- Options Hedging: Buying Nifty 21,500 Put options at ₹200 premiums can limit downside.
Strategies to Navigate the Breakout
Position Sizing and Diversification
- Allocate only 5% of your portfolio to high-risk trades.
- Diversify into defensive sectors like FMCG (HUL, ITC) if volatility spikes.
The “Barbell” Approach
- Balance safe bets (gold ETFs, bonds) with aggressive plays (PSU stocks, infra ETFs).
Real-Life Example: During the 2022 Russia-Ukraine crisis, traders using this strategy outperformed Nifty by 8%.
Psychological Resilience: Keeping Emotions in Check
Avoid These Pitfalls
- FOMO (Fear of Missing Out): Chasing momentum without a plan.
- Panic Selling: Exiting during intraday dips locks in losses.
Build a Disciplined Trading Plan
- Set entry/exit rules before trading.
- Review trades weekly to avoid repeating mistakes.
Conclusion: Preparing for All Outcomes
Whether Nifty holds or slips, success lies in preparation. As Warren Buffett says, “Be fearful when others are greedy, and greedy when others are fearful.” Stay agile, stay informed, and let data—not emotions—drive your decisions.
FAQ Section
Q: What’s the best indicator for predicting Nifty breakouts?
A: Combine RSI, MACD, and volume analysis for higher accuracy.
Q: Should I invest in Nifty ETFs now?
A: Dollar-cost averaging reduces risk during volatility. Invest small amounts regularly.
Q: How do geopolitical risks impact retail traders?
A: They increase volatility but create buying opportunities in undervalued stocks.